
Common Factors which influence our investment behaviour determines your wealth over the long term.
Last year the JSE returned 21%. The first quarter ending 31 March of this year saw a downward market movement of -6%. Since the end of March to now the market has regained the 6% and is at the levels of the beginning of the year. However, after the first quarterly statements were sent out there were numerous investors very concerned about the movement on their portfolios.
As humans we tend to react either to fear or greed. Fear would have been the obvious emotion at the end of the quarter, with many people wanting to move into more cautious investments. By doing this your portfolio moves from volatility to an actual paper loss. Similarly, taking long term investments and trying to make up, that which is only volatility, on getting quick rich schemes is by all extensions no different than going to the casino. There is no certainty.
Market history does however provide us with a degree of certainty. The underlying Graph provides clarity on several certain factors.
GRAPH EXPLANATION
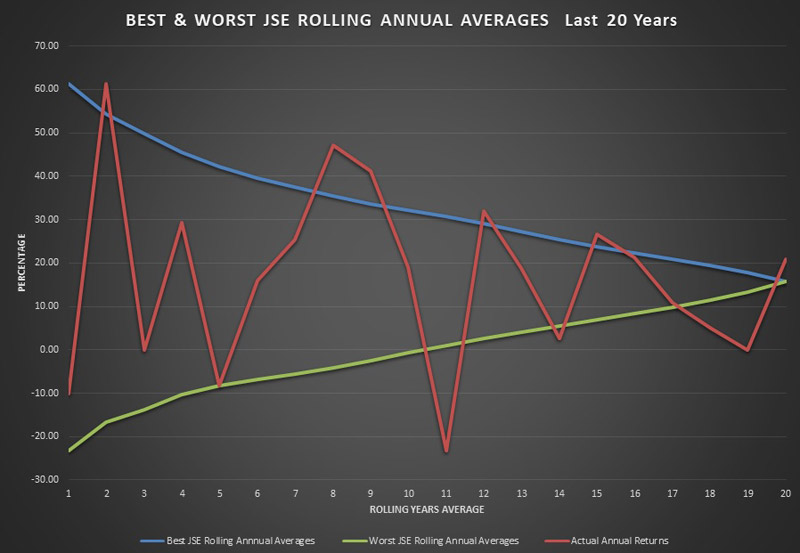
Point 1 on the X axis indicates the best return achieved over a one-year period in blue and the worst return over a one-year period in Grey.
Point 2 on the X axis indicates the best average return achieved over any two-year rolling period in blue and the worst average return over any two-year rolling period in Grey.
Point 3 on the X axis indicates the best average return achieved over any three-year rolling period in blue and the worst average return over any three-year rolling period in Grey.
And so forth…
The orange line depicts the actual annual return per annum in each specific year over the last 20 years.
WHAT DO WE UNDERSTAND FROM THE THIS GRAPH
- Over the past 20 years you can over any 1 year have an upside of 60% or a downside of -25%
- Over the past 20 years in any 2-year rolling period you can have an average upside of 55% or an average downside of -15%
- Extrapolate this further and over the past 20 years in any 5-year rolling period you can have an average upside of 42% or an average downside of -8%
- Extrapolate this further and over the past 20 years in any 10-year rolling period you can have an average upside of 32% or average return of 0%
- Extrapolate this further and over the past 20 years in any 15-year rolling period you can have an average upside of 26% or a lower average return of 7%
- And over the past 20 years the JSE has delivered an average upside of 15.83%
WHAT IS THE MORAL OF THE GRAPH?
- Over the past 20 years in any rolling 10-year period the market has never lost any money.
- In fact, if you take the last 40 years no one has ever lost money over any 7 year rolling period.
- The JSE has always delivered between 13% and 17% over any 20 Year rolling period.
INVESTMENT INSIGHT
- Investments are long term in nature.
- Short term volatility is just that, it is the very nature of long term investing.
- Capitalising volatility losses based on fear creates real losses.
- 1 quarters performance is very insignificant over a long period.
- Markets always revert to fair value.
- There is no way of getting rich quickly in the markets or schemes unless you speculate with high risk assets whereby you could also lose all your money.
- Know the risks that you are able to tolerate and allow for experts to diversify your portfolio accordingly. This will allow you to manage the amount of uncertainty you are willing accept. Then stick to your chosen strategy.
- Lastly, it has been proven by many statisticians and actuaries that time in the markets is more important than timing the markets.